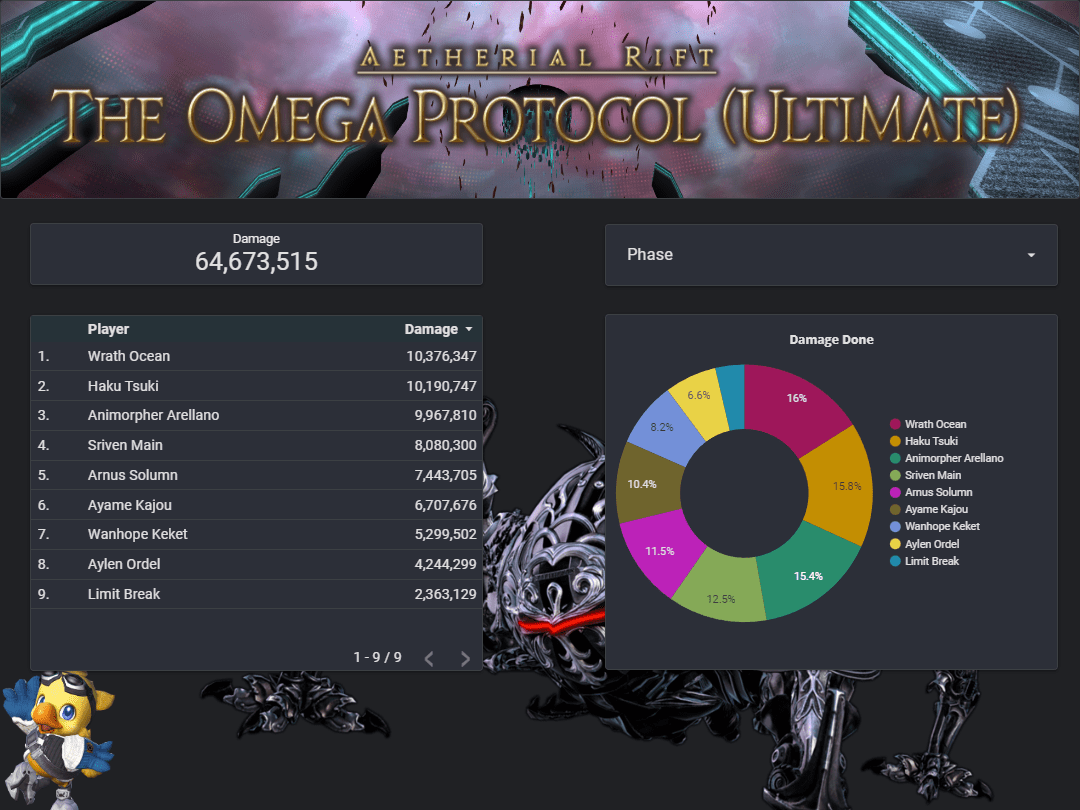
Back with another Final Fantasy XIV dashboard, this time for the most recent (and quite difficult) encounter, The Omega Protocol (Ultimate).
I started out this one by using GraphQL to collect data through the FFLogs API and imported the data into Google BigQuery. I ran a few SQL queries to preprocess the data (the queries in question can be found here on GitHub) and once again used Looker Studio to create an interactive dashboard with the query results.
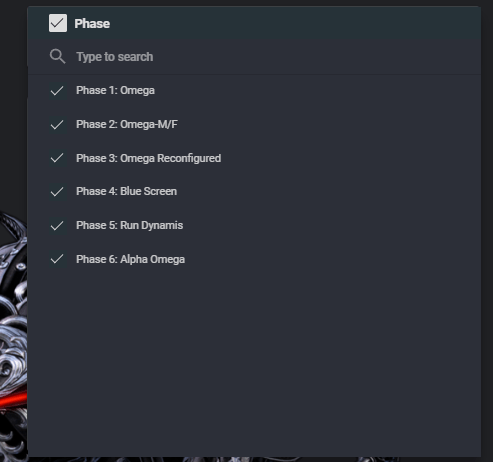
As this is an encounter with multiple phases, I added a dropdown control menu to select which phase(s) to filter the results for.
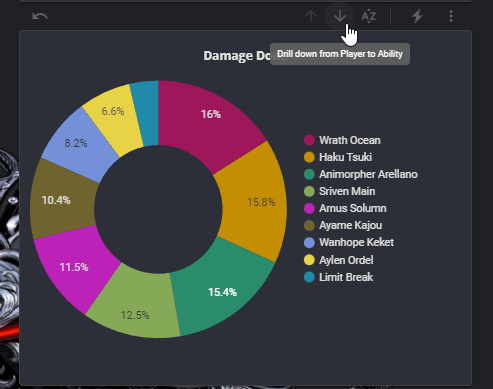
The dashboard also includes “drill down” buttons that can be used to modify the table or pie chart to display the damage done for each individual ability rather than by each player.

Making use of the drill down buttons and the phase control, we’re able to highlight individual players and neatly chart the damage dealt by each ability for a particular player in any phase of the fight.
You can access the full dashboard here.
